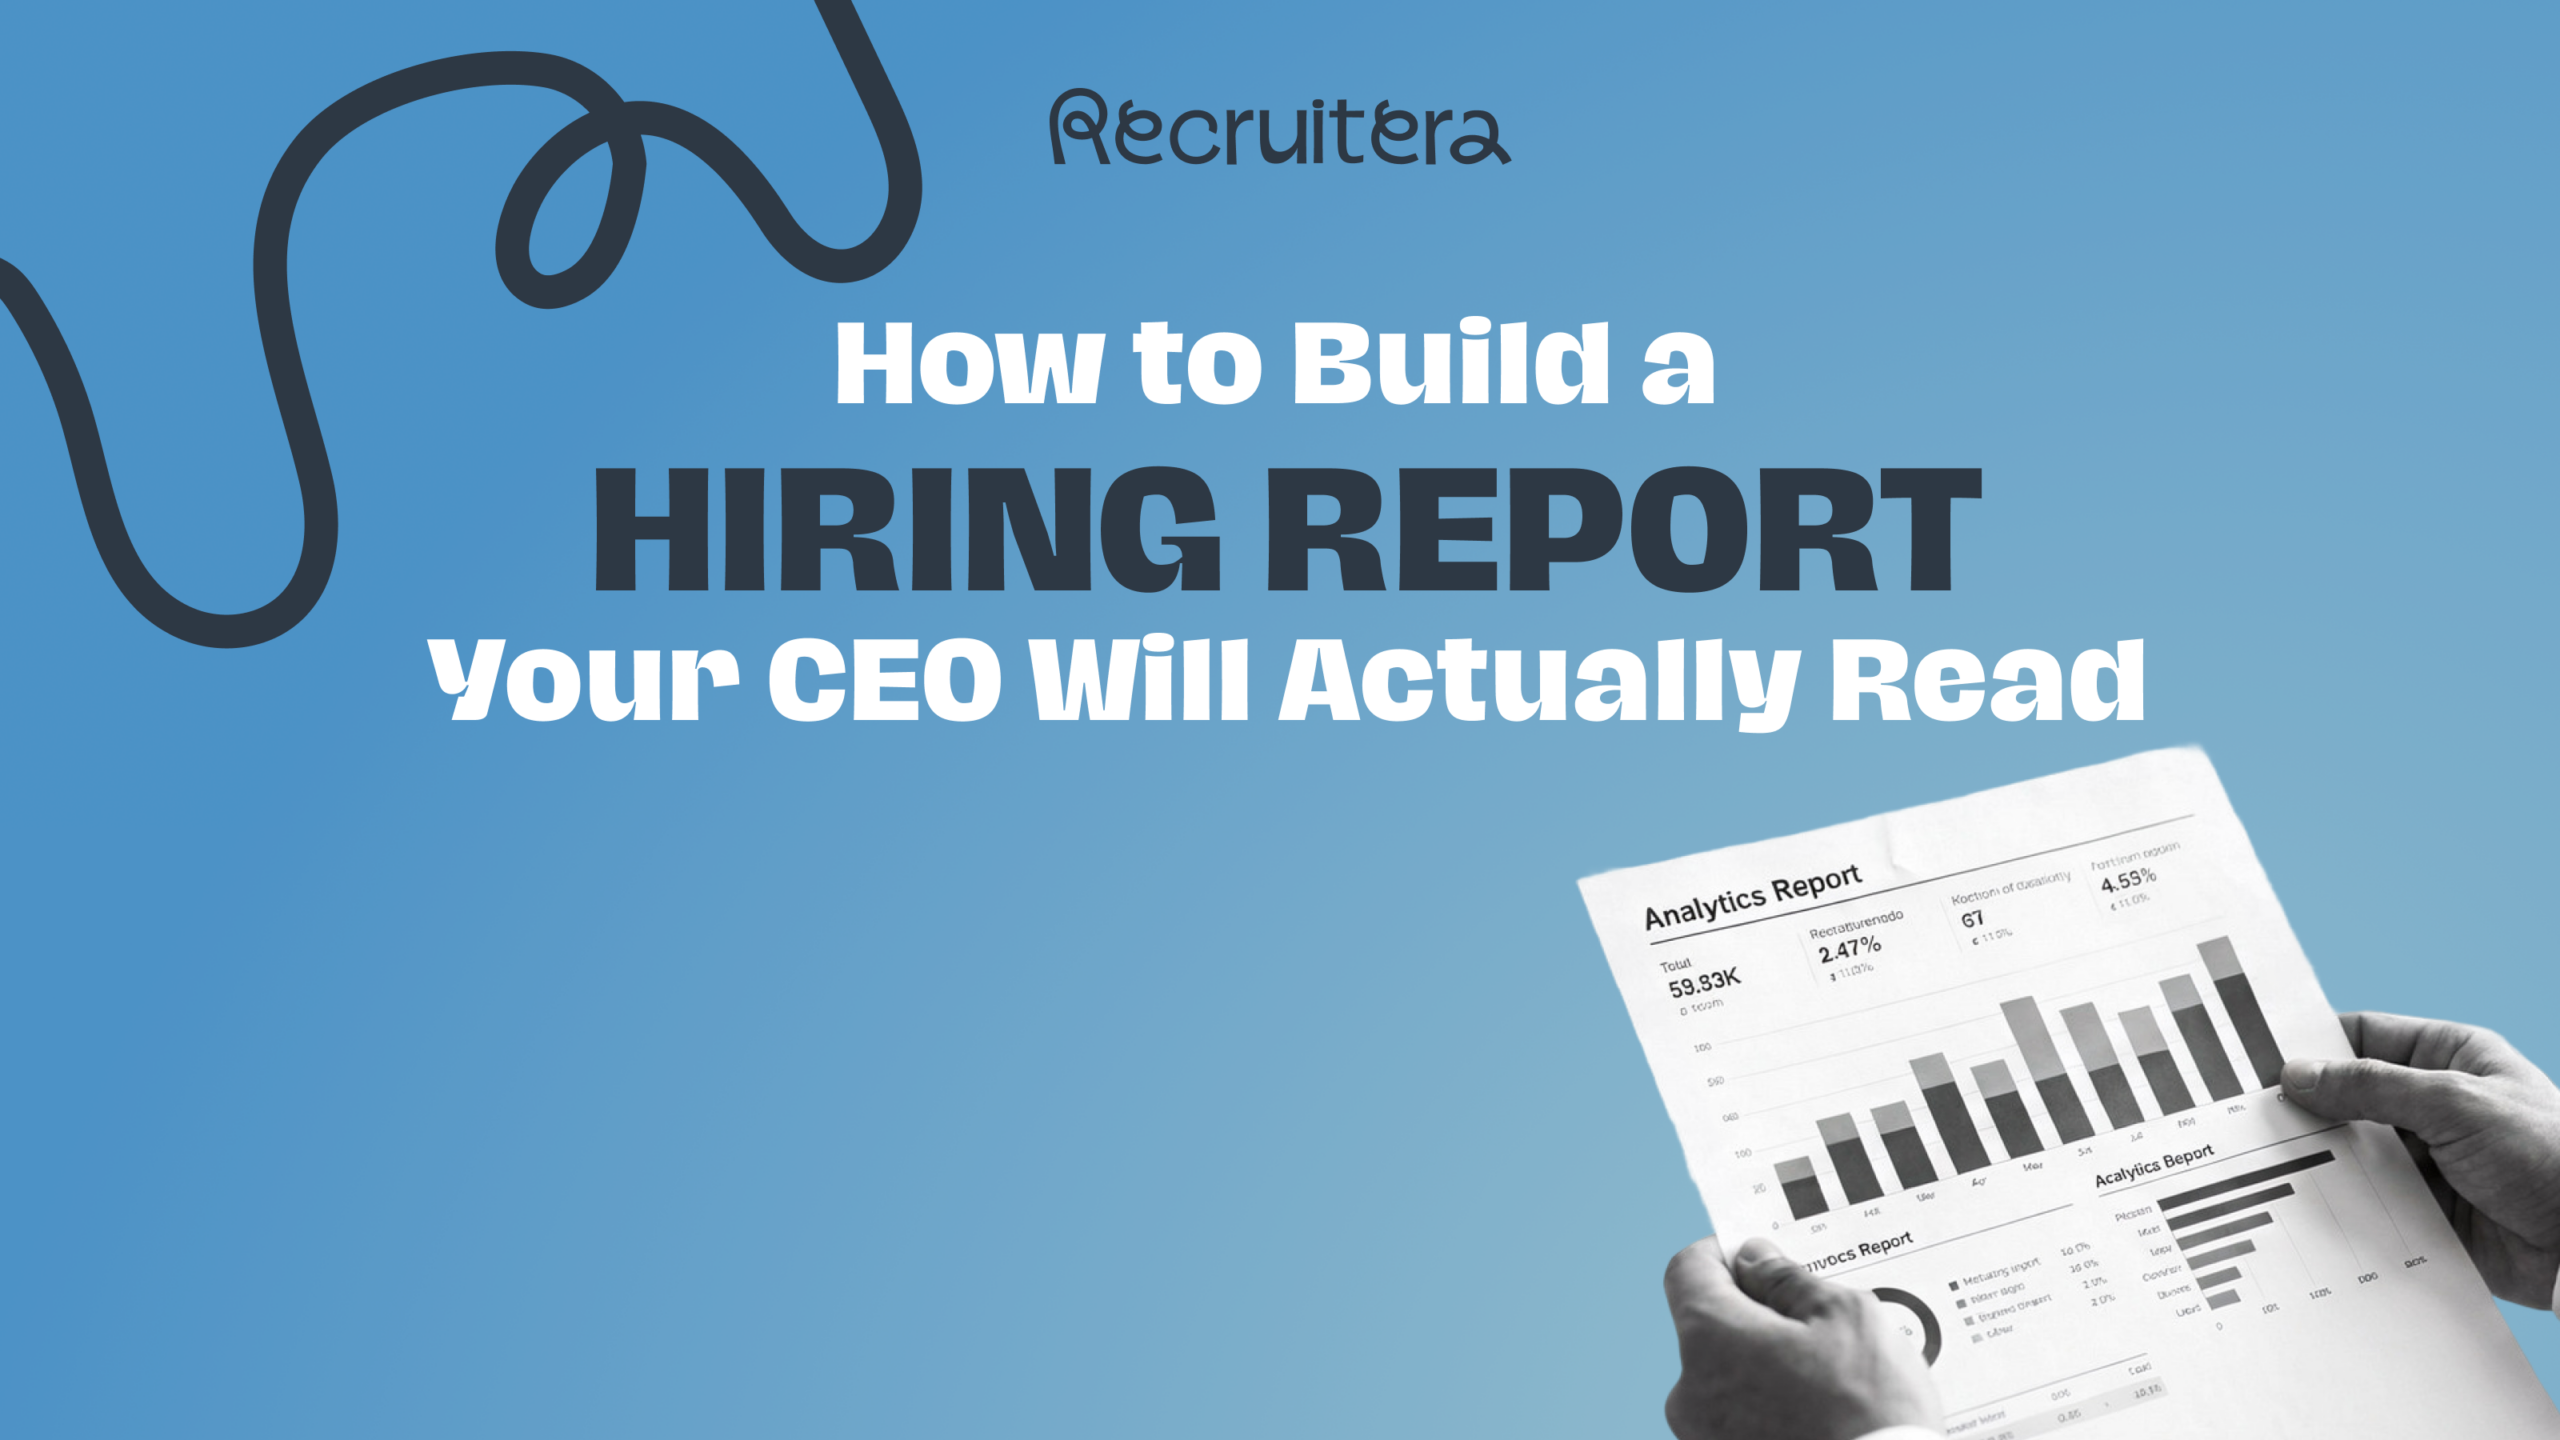

Every Sunday morning, somewhere, an HR Manager is opening Excel.
They're pulling last week's data out from scattered channels. Copying numbers into a table. Formatting columns. Trying to remember which formula calculates fill rate. Building, from scratch, the same report they built last week and the week before.
And then their CEO asks: "How are we doing on hiring?"
A useful hiring report shouldn't take two hours to produce. It shouldn't live in a spreadsheet that only one person knows how to build. And it definitely shouldn't be the thing that keeps you at your desk on Sunday night.
In this guide, we'll cover what a useful hiring report actually contains, what the most important metrics are and why they matter, and how modern ATS tools let you generate the whole thing in about 9 seconds.
Why Most Hiring Reports Don't Work
The problem with most hiring reports isn't that teams don't care about the data. It's that the data is in the wrong place, in the wrong format, or missing the context that makes it actionable.
Here's what typically goes wrong:
- The report only shows volume. Total applications. Total hires. But no conversion rates, no time metrics, no source breakdown. Your CEO sees numbers with no story.
- The data is stale. By the time you've exported, formatted, and sent the report, you're already looking at last week's reality.
- There's no way to filter. One report for the whole company, even if different departments have very different hiring realities.
- It's not shareable. Raw exports aren't something you walk into a board meeting with.
A useful hiring report solves all of these. It's real-time, filterable, and formatted for a human being — not a database admin.
What a Useful Hiring Report Includes
The best hiring reports answer four distinct questions, each with its own set of data. Think of them as four separate lenses on the same process.
First, Pipeline Health — Where Are Candidates Going?
This is your hiring funnel view. For each stage in your hiring process — Apply, Phone Screen, Interview, Evaluation, Offer, Hire — you want to know how many candidates reached each stage, what percentage moved to the next stage (conversion rate), and how long they spent there on average (avg time in stage). A stage with a low conversion rate and a high average time is a bottleneck. That's a process problem, not a sourcing problem.
Second, Rejection Patterns — Where and Why Are You Losing Candidates?
Most teams track how many candidates they hire. Fewer track why candidates leave the pipeline and from which sources. Your disqualification data should show which stage has the highest drop-off rate, what reasons are being logged, and which sourcing channels generate the most rejected candidates.
Third, Team Performance — Who Is Hiring How Fast?
Recruiter performance data is one of the most requested and least visible parts of hiring analytics. A good hiring report shows you, per recruiter: total hires within the period, time-to-hire, time-to-fill, and offer acceptance rate.
Fourth, Source Effectiveness — Which Channels Are Worth It?
Not all applications are equal. Compare your sourcing channels by hires versus disqualified candidates per source. A channel generating 40% of your applications but only 5% of your hires is costing you screening time, not delivering value.
The Filter Problem Most ATS Tools Don't Solve
Even when teams have hiring reports, they often end up rebuilding them every time because the reports aren't filterable in a way that reflects how their company is actually structured. The four filters that make a hiring report genuinely useful are: Date Range, Department, Job, and Team Member. Applied individually or in combination, they turn a company-level summary into a decision-making tool.
What This Looks Like in Recruitera
Recruitera's updated Reports module is built around exactly these four reporting needs:
- Hiring Funnel — Stage-by-stage pipeline view with conversion rates, avg time in stage, and a candidates-over-time chart.
- Disqualification — Rejection breakdown by stage and source, with a disqualification reasons chart.
- Hires — Team performance view with individual recruiter metrics and a hires-by-source breakdown.
- Candidates — Source effectiveness table comparing hires versus disqualified candidates per channel.
All four reports support filtering by Date, Department, Job, and Team Member, combinable. And every report can be printed with section-level control.
Final Thought
A good hiring report isn't a summary of activity. It's a decision-making tool. It tells you where to focus, what to fix, and what's already working. The best ones take 9 seconds to generate, not 9 hours. If yours still takes that much, that's worth fixing.
جاهز للتوظيف بذكاء أكبر؟
يساعدك ريكروتيرا على رؤية الشخص وراء السيرة الذاتية. احجز عرضًا توضيحيًا سريعًا واكتشف طريقة أفضل لبناء فريقك.
احجز عرضًا توضيحيًا

مركز المعرفة الأول لمسؤولي التوظيف.
تصفّح الموارد ←أدلة عملية حول استقطاب المواهب وإجراء المقابلات وبناء العلامة التوظيفية في المنطقة.
اقرأ المدونة ←أوصاف وظيفية وخطابات عروض عمل وبطاقات تقييم للمقابلات وقوائم تهيئة الموظفين الجدد، جاهزة للنسخ.
تصفّح القوالب ←